HKU Jockey Club Enterprise Sustainability Global Research Institute
World-Class Hub for Sustainability
HomeHong Kong Economic Policy Gree...1.1 Typhoons: The Most Frequen...
1. Overview of Climate Risks in Hong Kong
1.1 Typhoons: The Most Frequent Climate Disaster in Hong Kong
Figure 1. Historical typhoon tracks and intensity from 2014 to 2023.
Panel A. Historical Typhoon Tracks
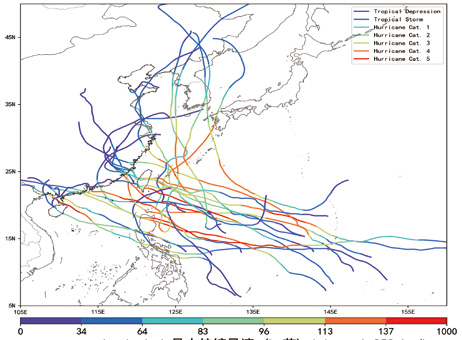
Panel B. Historical Typhoon Intensity
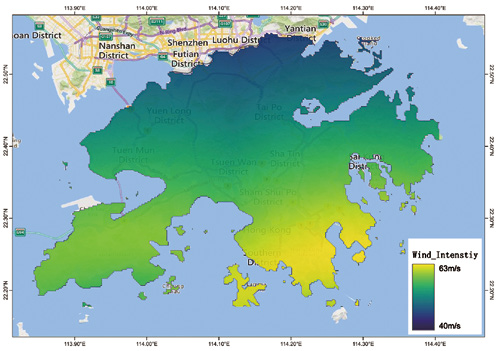
Notes: This figure shows the analysis of typhoons affecting Hong Kong with two panels. Panel A (Left) shows the statistical representation of typhoons in the northwest Pacific region from 2014 to 2023. Typhoons are categorized by intensity levels equal to or exceeding Category 3 typhoons, which is significant for Hong Kong. The depicted line segments represent typhoon trajectories, with a color gradient from purple to red indicating increasing storm intensity. The maximum intensity recorded is capped at ≤137 knots, or 210 km/h, with the peak observed in 2023. Panel B (Right) illustrates the historical record of the maximum intensities of typhoons impacting Hong Kong. Peak intensities across different regions range from 40 m/s to 63 m/s. (Data source: YoujiVest Climate Lab)
Figure 1 summarizes typhoon activity affecting Hong Kong and mainland China from 2014 to 2023. Panel A shows that many typhoons have made landfall in Hong Kong and nearby areas, making Hong Kong a particularly vulnerable site for typhoon-related damage. Panel B further examines historical typhoon intensity patterns in Hong Kong, revealing an increase in intensity from the northwest to the southeast, with Hong Kong Island being the most affected. Hong Kong Island is not only the economic center of Hong Kong but also a densely populated area with significant production activity. Buildings and infrastructures in the area face elevated risks when strong winds strike, especially those directly exposed to high wind speeds.
Figure 2. The number and duration of typhoons occurring in Hong Kong each year from 2004 to 2023
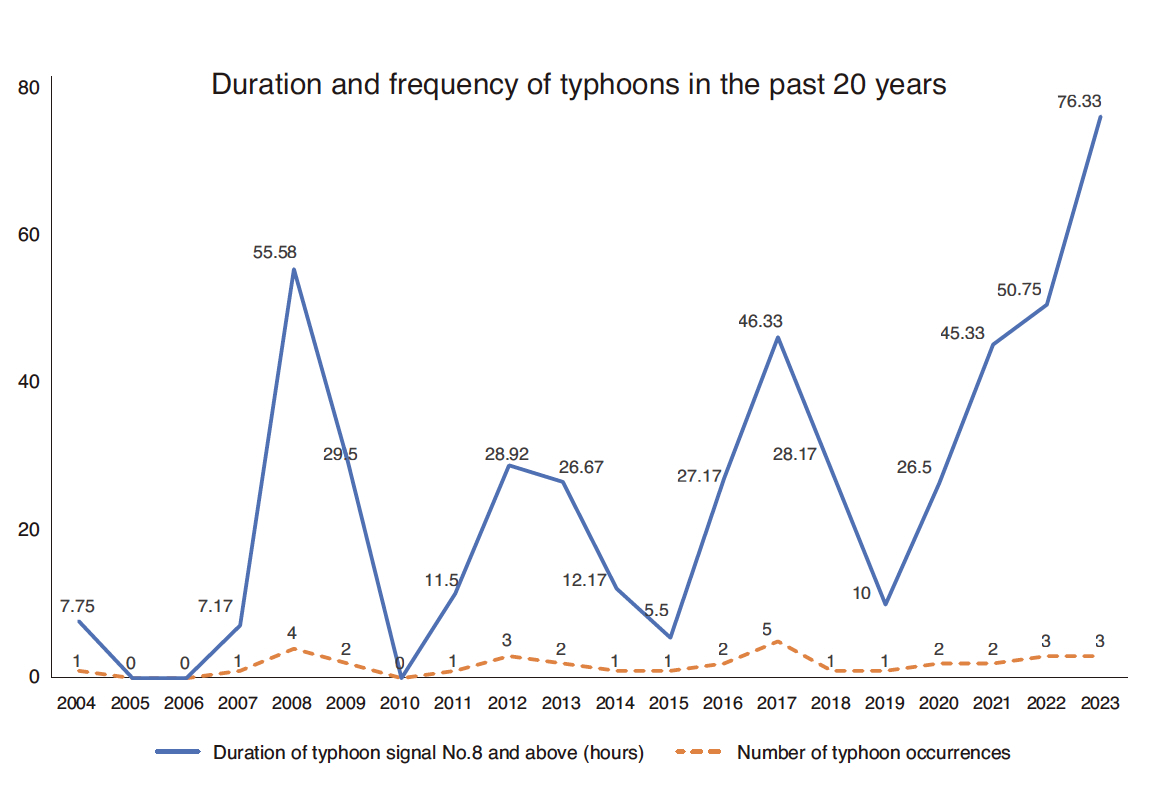
Notes: The blue line represents the annual cumulative duration of typhoon Signal No. 8 or above issued by the HKO. The yellow dotted line represents the number of typhoons making landfall or severely affecting the region each year. The cumulative duration of typhoon signal No. 8 and above shows a significant surge in 2023, the highest record in two decades. (Data source: Hong Kong Observatory)
Figure 2 summarizes the duration and frequency of typhoons (Signal No.8 or higher) in the past two decades. We observe that Hong Kong has been hit more frequently by typhoons, while the duration of severe typhoons has also increased. Notably, three severe typhoons struck Hong Kong in 2023, resulting in a cumulative 76 hours of Signal No.8 or higher. Hurricane Signal No. 10 was issued during the passage of “Saola,” Storm Signal No. 9 was issued during the passage of “Koinu,” and Gale or Storm Signal No. 8 was issued during the passage of “Talim.”