HKU Jockey Club Enterprise Sustainability Global Research Institute
World-Class Hub for Sustainability
HomeHKU JC Sustainability IndexLocal Energy Zone-related Inde...
Local Energy Zone-related Index
Local Energy Zone-related Index
Objectives
A novel research paradigm and dataset – dubbed ‘LEZ’ – will be introduced to facilitate urban carbon neutrality research and assessment globally, with particular relevance for China. Distinguished by its high spatial resolution, standardization and multi-sector coverage, this paradigm will enable precise urban carbon accounting, spatial modeling, and spatiotemporal forecasting.
The LEZ initiative is positioned to become an authoritative reference for governments, corporations, and stakeholders seeking both quantitative metrics and qualitative evaluations of carbon emissions, which will further enhance the ESG / climate influence and leadership of all stakeholders.
Key Innovation
- • Through multi-scale analysis of land use and carbon emission inventories at the prefectural-city level across China, we standardized energy-land zoning for China and the world based on the homogeneity and heterogeneity of energy consumption/carbon emission patterns.
- • Hybrid “top-down” and “bottom-up” research paradigm bridges the inconsistencies and gaps between these traditionally isolated approaches.
- • The framework offers a standardized yet flexible methodology, providing a reference dataset for energy-geography-environment studies while enabling adaptable applications across diverse environment-social-governance (ESG) research scenarios (Carbon justice, carbon auditing, carbon equity, etc).
Methodology
A hybrid ‘top-down’ and ‘bottom-up’ methodology is employed for urban carbon emission accounting, spatial modeling, and spatiotemporal forecasting.
The top-down approach primarily utilizes remote sensing technology and spatiotemporal big data to generate LEZ (Local Energy Zone) maps for any region of interest globally, serving as the foundation for subsequent energy/carbon emission analyses. Key components include:
- • A super-large LEZ-generate model developed on Google Earth Engine platform, bearing massive spatiotemporal datasets and computational resources;
- • A 47-category feature set encompassing spectral, textural, physical, and semantic information of targets;
- • Supervised and unsupervised learning techniques applied to sample dataset collection, effectively addressing data gaps.
The ‘bottom-up’ approach primarily leverages existing energy statistics and derived proxy data to assess metadata on energy consumption/emissions across various energy sectors, industries, and departments. Multiple regression models, data assimilation techniques, and machine learning methods are employed for metadata extraction and analysis.
Variables and Formats
Data description summary:
- • Local Energy Zone Map across China in 2020.
- • Sectoral spatial-temporal carbon emissions inventory.
- • LEZ – originated indexes (For example, Industry emission-index).
Findings & Results
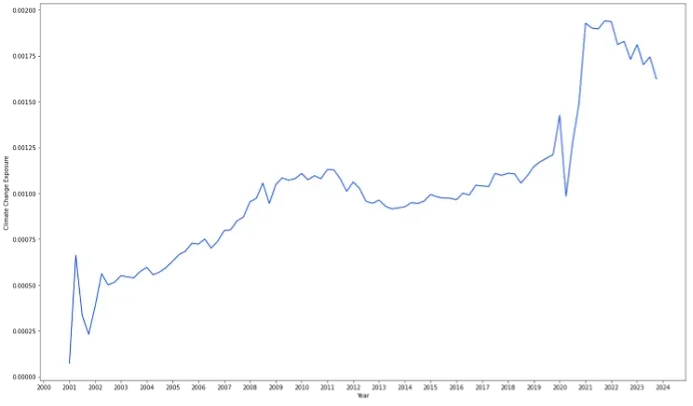
Figure 1 Climate Change Exposure (CCE) rockets in 2021 and then cools down
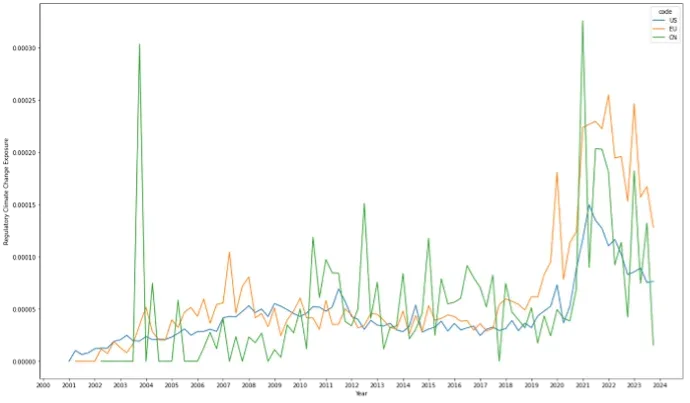
Figure 2 Europe leads Regulatory CCE in recent years
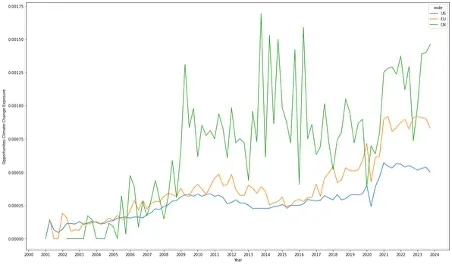
Figure 3 China Opportunity CCE leads US / Europe
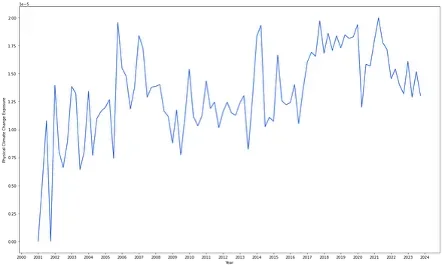
Figure 4 Physical CCE remains volatile
Coverage
- • Geographical coverage: China and even the whole world;
- • Departmental coverage: heavy / light industry, urban residents, rural residents, agriculture, transportation, public services and commerce.
- • Interest stakeholders’ coverage: governments, committees, citizens and large factories/companies.
Update Frequency
Annually
Papers that Develop and Use these data
Wang R F, Ren C (2025). Local energy zone for urban carbon emissions studies–Accounting, characterization and prediction. Applied Energy, 2025, 390: 125865. https://doi.org/10.1016/j.apenergy.2025.125865