HKU Jockey Club Enterprise Sustainability Global Research Institute
World-Class Hub for Sustainability
HomeHKU Sustainability IndexCarbon Emission Perceptions by...
Carbon Emission Perceptions by Consumers
Carbon Emission Perceptions by Consumers
Objectives
This index development aims to highlight the gap between consumer beliefs about carbon emissions from product manufacturing and the actual emissions. To measure consumers’ perceptions of carbon emissions, we will create a scale. Many consumers assume that more hedonic products emit more carbon compared to utilitarian products, while the reality may be the opposite. This project seeks to provide evidence for this perception gap and suggest interventions to bridge it, ultimately improving the carbon emission image of hedonic versus utilitarian products.
Key Innovation
- • Focus on Consumer Perception: Unlike traditional indices, our index specifically addresses the gap between consumer beliefs and actual carbon emissions, providing insights into public perceptions.
- • Targeted Measurement Scale: We will develop a dedicated scale to accurately measure consumer perceptions of carbon emissions, ensuring that our findings are robust and reliable.
- • Evidence-Based Interventions: The project will not only identify perception gaps but also suggest targeted interventions to align consumer beliefs with reality, fostering more informed purchasing decisions.
- • Contribution to Positive Brand Image: By improving the carbon emission narrative around hedonic versus utilitarian products, our index can help brands enhance their sustainability image, driving consumer trust and loyalty.
- • Actionable Insights for Stakeholders: The findings will provide valuable data for manufacturers, marketers, and policymakers, enabling them to address misconceptions and promote more sustainable practices effectively.
Variables and Formats
Methodology
- • Concept Explanation: We began by explaining the concept of service carbon footprint to participants, ensuring they understood its relevance and application.
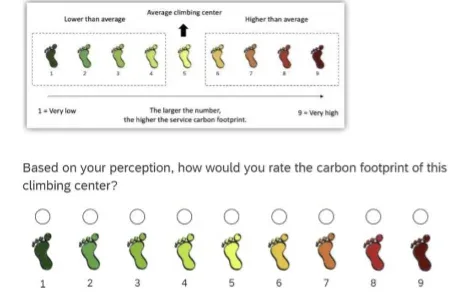
- • Adaptation of Carbon Footprint Scale: We utilized a carbon footprint scale adapted from Gorissen and Weijters (2016) to assess consumer perceptions. This scale includes a 9-point traffic light system, providing clear visual cues for participants.
- • Comprehension Check: To ensure participants fully understood the scale, we included a single-item comprehension check: “Please indicate the average carbon footprint of all climbing centers.” This step was crucial for validating their understanding before proceeding to the main assessment.
- • Perception Assessment: Participants rated the carbon footprint of a specific service/product using the same 9-point traffic light scale (see an attached file for an example). The question posed was: “Based on your perception, how would you rate the carbon footprint of this product/service?” This direct query aimed to capture their subjective assessment accurately.
- • Survey Development: The scale and accompanying questions were developed through a consumer survey, which allowed us to gather a diverse range of perceptions from different demographic groups. This broad data set enhances the reliability of our findings.
- • Data Analysis: The responses were analyzed to identify patterns in consumer perceptions, particularly focusing on discrepancies between perceived and actual carbon emissions. This analysis will inform how we can improve the carbon emission image of hedonic versus utilitarian products.
- • Consistency and Replicability: By employing a standardized scale and clear assessment methods, our research design ensures consistency in data collection. The methodology can be replicated in future studies, allowing for comparative analysis across different contexts or product categories.
Figures
Coverage
Fifty consumer products and services from various sectors
Update Frequency
Annually
Meet the Experts

Note: This index development is based on the project with Prof. Lili Wang at Zhejiang University and her PhD student, Jianuo (Nora) Ma.